Scatter Plot
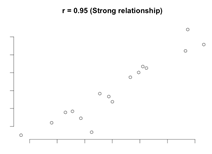
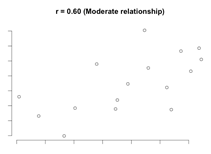
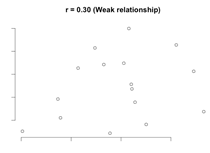
The Scatter Plot command produces scatter diagram (scatterplot). One variable (X variable) is plotted on the horizontal axis, and the other (Y variable) is plotted on the vertical axis. The resulting pattern can graphically reveal the relationship between the variables.
Patterns for different types of relationship between two variables
|
|
|
|
How To
Run: Charts→ Scatter Plot command.
Select an independent variable (plotted on the X-axis) and a dependent variable (plotted on the Y-axis).
Optionally, use the Group variable to get separate scatterplot for each sub-group defined by the group variable.