Compare Multiple Related Samples
The command compares multiple related samples using the Friedman test (nonparametric alternative to the one-way ANOVA with repeated measures) and calculates the Kendall's coefficient of concordance (also known as Kendall’s W). Kendall's W makes no assumptions about the underlying probability distribution and allows to handle any number of outcomes, unlike the standard Pearson correlation coefficient. Friedman test is similar to the Kruskal-Wallis one-way analysis of variance with the difference that Friedman test is an alternative to the repeated measures ANOVA with balanced design.
How To
For unstacked data (each column is a sample):
o Run the Statistics→Nonparametric Statistics → Compare Multiple Related Samples [Friedman ANOVA, Concordance] command.
o Select variables to compare.
For stacked data (with a group variable):
o Run the Statistics→Nonparametric Statistics → Compare Multiple Related Samples (with group variable) command.
o Select a variable with observations (Variable) and a text or numeric variable with the group names (Groups).
Results
The report includes Friedman ANOVA and Kendall’s W test results.
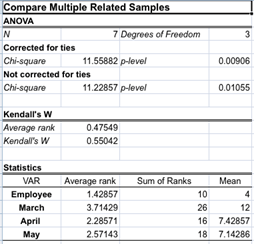
The Friedman ANOVA tests
the null hypothesis that the samples are from identical populations. If the p-value
is less than the selected ![]() level
the null-hypothesis is rejected.
level
the null-hypothesis is rejected.
If there are no ties, Friedman test statistic Ft is defined as:
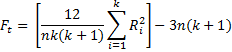
where n is the number of rows, or subjects; k is the number of columns or conditions, and Ri is the sum of the ranks of ith column.
If ranking results in any ties, the Friedman test statistic Ft is defined as:
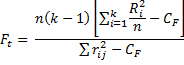
where n is the number rows, or subjects, k is the number of columns, and Ri is the sum of the ranks from column, or condition I; CF is the ties correction (Corder et al., 2009). When n > 15 or k > 4 the test statistic approximately follows chi-square distribution with d.f.= k – 1.
Kendall’s W is used to assess the agreement between samples, it is a normalization of the Friedman test statistic and ranges from 0 (no agreement) to 1 (complete agreement).
Kendall’s W is defined by:
![]()
where m is a number of raters, rating k subjects in a rank order from 1 to k. R is a squared deviation.
References
Conover, W. J. (1999), Practical Nonparametric Statistics, Third Edition, New York: John Wiley & Sons.
Corder, Gregory W., Foreman, Dale I. (2009). Nonparametric Statistics for Non-Statisticians: A Step-by-Step Approach.
Friedman, Milton (March 1940). A comparison of alternative tests of significance for the problem of m rankings. The Annals of Mathematical Statistics 11 (1): 86–92.