StatPlus:mac
お客様は、今手に入る中でもっともユーザーフレンドリーなコンピュータのマッキントッシュを選ばれた方です。Macは、毎日行なうことに必要なあらゆるツールが使えるすばらしいプラットフォームです。厳格なインタフェース要求のおかげで、サードパーティ製のツールであってもマッキントッシュのネイティブソフトウェアと同様に覚えやすく、使いやすくなっています。 しかしもしお客様の仕事が数式を多用する業界、たとえば薬理学、医学、経営などで、複雑な統計分析が日常業務の一部だとしたらどうでしょう。Mac上で動作するユーザーフレンドリーなデータ解析ツールを見たことがあるでしょうか。 Mac流のユーザーフレンドリーさをもつ統計分析ツールはありませんでした。実際、Mac上で動くデータ解析ツールというものはほとんどありませんでした。それがユーザーフレンドリーであろうとなかろうと。一般的には、2つの選択肢つまり、高価で重装備な、むやみに複雑な統計パッケージか、軽くて覚えやすいツール、Microsoft Excelのような、から選ぶことになります。 Microsoft Excelは、一定のデータ分析機能を提供し、日常の統計ツールとして見れば十分ユーザーフレンドリーです。しかし、「本物」の統計パッケージの代わりとして使えるほど強力でしょうか。
そして忘れてはならないのが、Mac流のユーザーフレンドリーなデータ分析機能ツールが手に入るということです。もう法外な価格や困難な学習といったこととは無縁です。慣れ親しんだMicrosoft Excel環境の中で作業しながら、StatPlus:macで重装備の分析を行ってください。
Upgrade Your Spreadsheet
StatPlus:macは、別のソフトウェアを購入して新たに学ぶことなく、お客様がお持ちのMicrosoft Excel 2004-2021を強力な統計分析ツールに変えてくれます。使い慣れたMicrosoft Excelインタフェースを複雑な分析や計算のために使い、どうやって結果を得るかに悩むのではなく結果の分析に集中できるようになります。 StatPlus:macを利用して、再現可能な、業界標準の結果を手に入れましょう。ISO2602:1980、ISO 2854:1976、ISO 3207:1975標準をサポートすることにより、分析の繰り返しで首尾一貫した再現性のある結果が得られます。データ処理操作は、非常に基本的なものから高度なものまで多くのものが用意されています。
70+ Features
StatPlus:mac allows Mac users to perform all forms of data analysis from the very basics to complex analysis, including as non-parametric and regression analysis, survival analysis, and a wide variety of other methods. Version 6 includes standalone spreadsheet and can be used without Microsoft Excel or Apple Numbers installed.
Multi-platform
StatPlus:mac is available for both Mac and PC platforms (PC version includes standalone and Excel add-in versions) at no extra charge. Save learning time and costs for your mixed PC and Mac environment.
Free Trial
We have free trial that gives you an opportunity to evaluate the software before you purchase it. Should you have any questions during the trial period, please feel free to contact our Support Team.
Affordable
StatPlus:mac is most affordable solution for data analysis on Mac (with Excel and Numbers support). You will benefit from the reduced learning curve and attractive pricing while enjoying the benefits of precise routines and calculations. Mac/PC license is permanent, there is no renewal charges.
Requirements
StatPlus:mac requires macOS 10.7-12 (Monterey). StatPlus:mac supports Microsoft Excel for Mac (supported versions: 2004, 2008, 2011, 2016, 2019, 2021) and Apple Numbers as a data source. StatPlus:mac does not require Internet connection (except for optional auto-update feature).
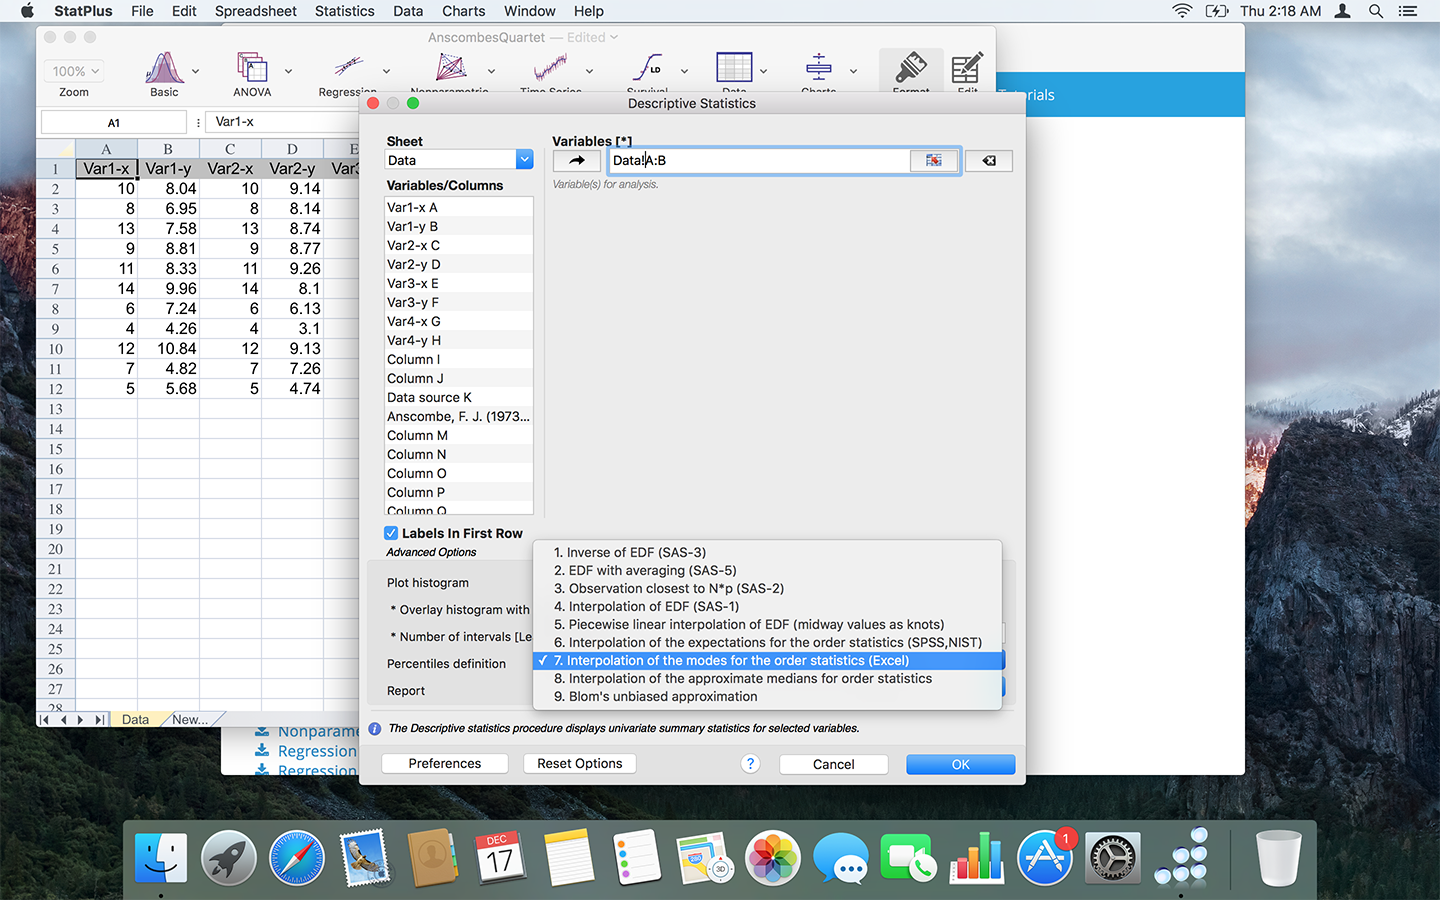
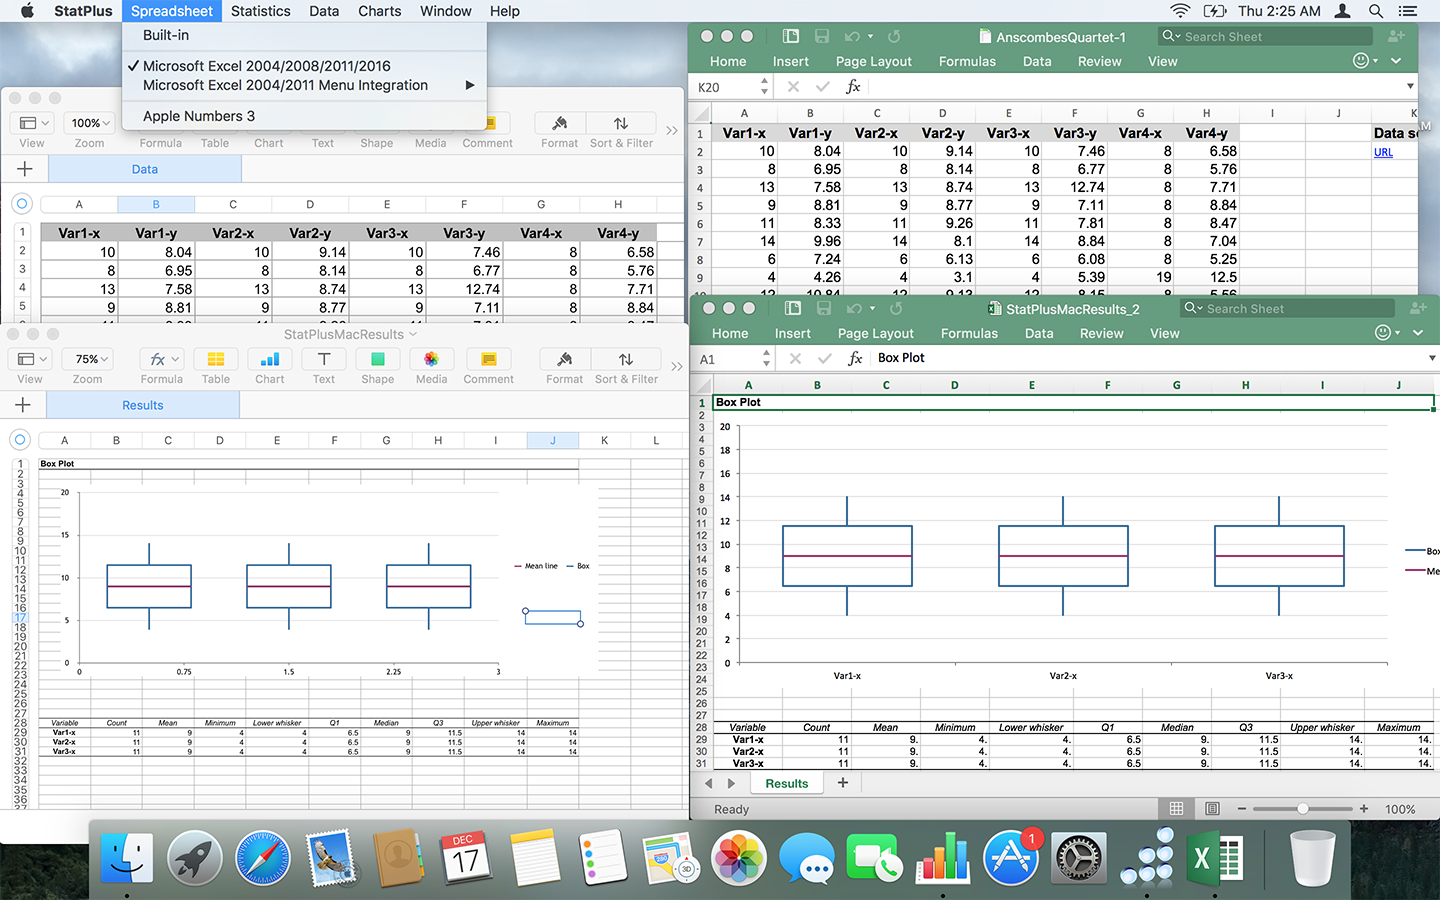
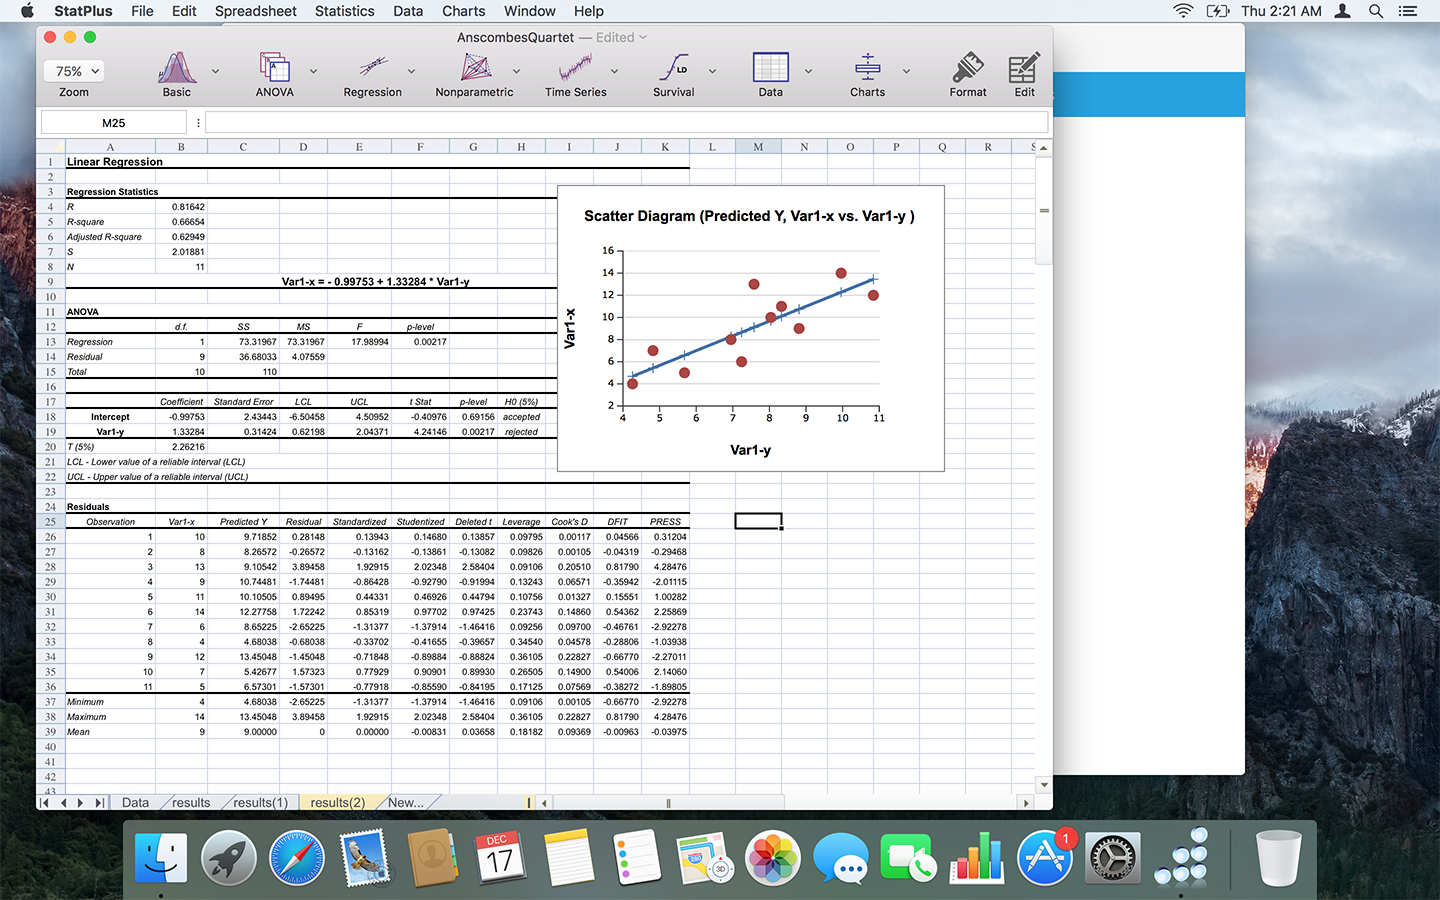
画面例


統計機能一覧:
- Pro Features
- Standalone spreadsheet with Excel (XLS and XLSX), OpenOffice/LibreOffce Calc (ODS) and text documents support.
- 'Add-in' mode for Excel 2004, 2008, 2011, 2016, 2019 and 2021.
- 'Add-in' mode for Apple Numbers.
- Priority support.
- Permanent license and free major upgrades during the maintenance period.
- Access to Windows version.
- Options to emulate Excel Analysis ToolPak results and migration guide for users switching from Analysis ToolPak.
- Basic Statistics
- Detailed descriptive statistics.
- One-sample t-test.
- Two-sample t-test.
- Two-sample t-test for summarized data.
- Fisher F-test.
- One-sample and two-sample z-tests.
- Correlation analysis and covariance.
- Normality tests (Jarque-Bera, Shapiro-Wilk, Shapiro-Francia, Cramer-von Mises, Anderson-Darling, Kolmogorov-Smirnov, D'Agostino's tests).
- Cross-tabulation and Chi-square.
- Frequency tables analysis (for discrete and continuous variables).
- Multiple definitions for computing quantile statistics.
- Analysis of Variance (ANOVA)
- One-way and two-way ANOVA (with and without replications).
- Three-way analysis of variance.
- Post-hoc comparisons - Bonferroni, Tukey-Kramer, Tukey B, Tukey HSD, Neuman-Keuls, Dunnett.
- Within subjects ANOVA and mixed models.
- Multivariate Analysis
- Principal component analysis (PCA).
- Factor analysis (FA).
- Discriminant function analysis.
- Hierarchical Clustering and K-Means.
- Nonparametric Statistics
- 2x2 tables analysis (Chi-square, Yates Chi-square, Exact Fisher Test, etc.).
- Rank and percentile.
- Chi-square test.
- Rank correlations (Kendall Tau, Spearman R, Gamma, Fechner).
- Comparing independent samples
Mann-Whitney U Test, Kolmogorov-Smirnov test, Wald-Wolfowitz Runs Test, Rosenbaum Criterion. Kruskal-Wallis ANOVA and Median test. - Comparing dependent samples
Wilcoxon Matched Pairs Test, Sign Test, Friedman ANOVA, Kendall's W (coefficient of concordance). - Cochran's Q Test.
- Regression Analysis
- Multivariate linear regression (residuals analysis, collinearity diagnostics, confidence and prediction bands).
- Weighted least squares (WLS) regression.
- Logistic regression.
- Stepwise (forward and backward) regression.
- Polynomial regression.
- Curve fitting.
- Tests for heteroscedasticity: Breusch–Pagan test (BPG), Harvey test, Glejser test, Engle's ARCH test (Lagrange multiplier) and White test.
- Time Series Analysis
- Data processing.
- Fourier analysis.
- Smoothing.
- Moving average.
- Analysis.
- Autocorrelation (ACF and PACF).
- Interrupted time series analysis.
- Unit root tests - Dickey–Fuller, Augmented Dickey–Fuller (ADF test), Phillips–Perron (PP test), Kwiatkowski–Phillips–Schmidt–Shin (KPSS test).
- Survival Analysis
- Life tables.
- Kaplan-Meier (log rank test, hazard ratios).
- Cox proportional-hazards regression.
- Probit-analysis (Finney and LPM).
LD values (LD50/ED50 and others), cumulative coefficient calculation. - Receiver operating characteristic curves analysis (ROC analysis).
AUC methods - DeLong's, Hanley and McNeil's. Report includes: AUC (with confidence intervals), curve coordinates, performance indicators - sensitivity and specificity (with confidence intervals), accuracy, positive and negative predictive values, Youden's J (Youden's index), Precision-Recall plot. - Comparing ROC curves.
- Data Processing
- Sampling (random, periodic, conditional).
- Random numbers generation.
- Standardization.
- Stack/unstack operations.
- Matrix operations.
- Statistical Charts
- Histogram
- Scatterplot.
- Box plot.
- Stem-and-leaf plot.
- Bland-Altman plot.
- Bland-Altman plot with multiple measurements per subject.
- Quantile-quantile Q-Q plots for different distributions.
- Control charts - X-bar, R-chart, S-chart, IMR-chart, P-chart, C-chart, U-chart, CUSUM-chart.

