StatFi
Unleash the full power of precise statistical analysis in Microsoft Excel. With StatFi you can perform complex data analysis in the familiar environment. No need to learn the new tricks with StatFi!
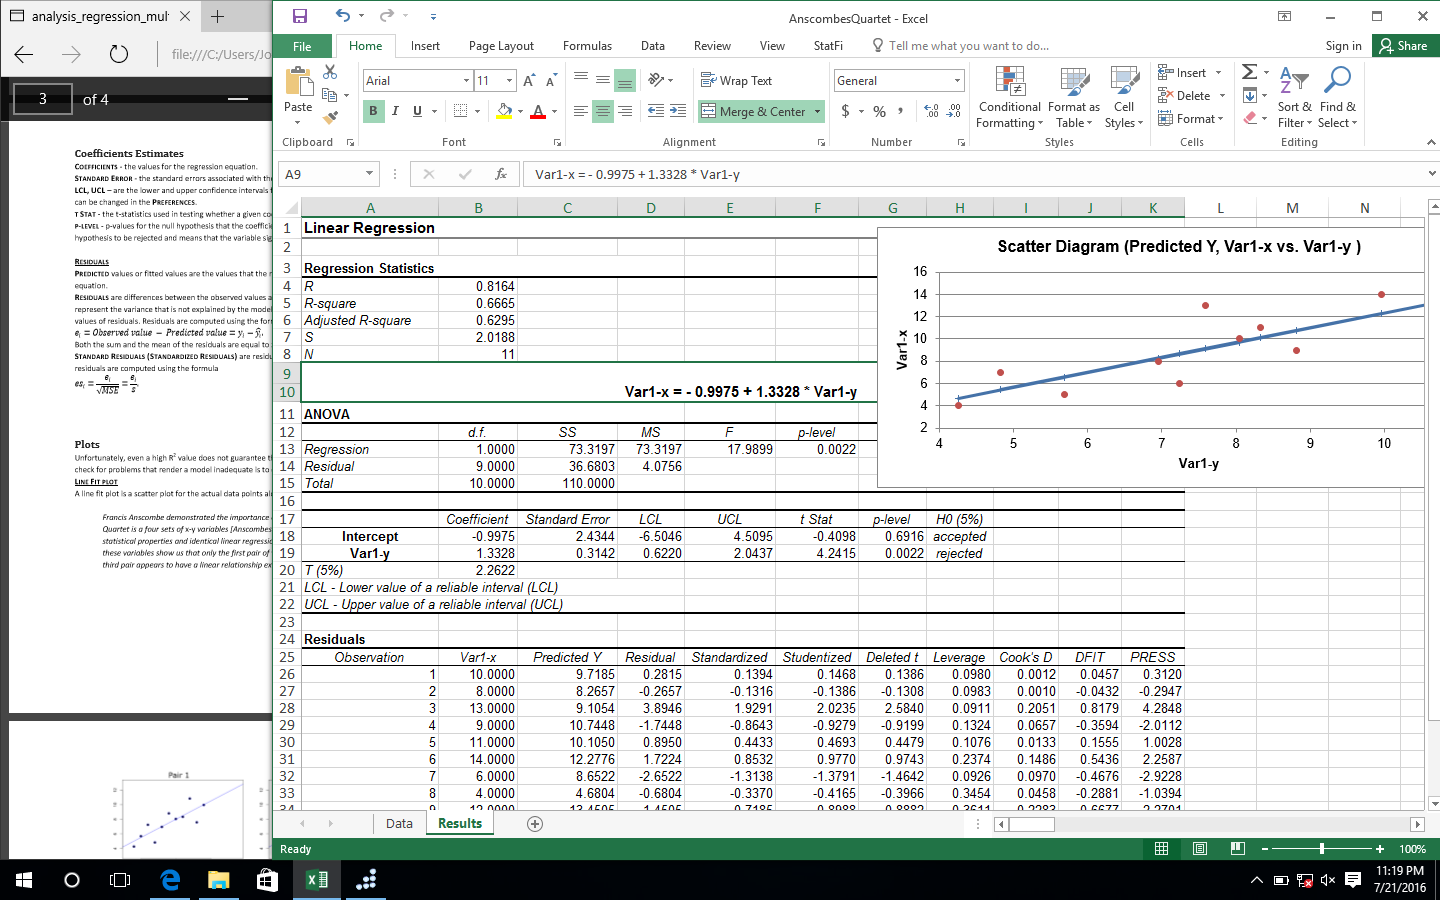
Bare Microsoft Excel is of very limited use for performing complex statistical analysis. Unless your analysis setup as basic as simple summaries or simple tests, and unless the precision requirements are rough, using Excel to perform the analytical tasks is a bad idea. Fortunately, your choice is not limited to either Excel or industrial software. StatFi expands the statistical and analytical abilities of Microsoft Excel, adding wide variety of methods and precise calculations.
StatFi 6 comes as a part of StatPlus 6 package.
Affordable
Heavy-duty stand-alone statistical packages are available on the market, but are you prepared to learn the new workflow? Switching applications means learning how to use the new tool, possibly spending hours to learn about the features you might never need. Considering the cost of most stand-alone analytical packages, they are ruled out of the equation by many users. With StatFi you will benefit from both the reduced learning curve and attractive pricing. License is permanent, there is no renewal charges.
Statistics
StatFi enables you to perform analytical and statistical calculations such as basic statistics, ANOVA, non-parametric and regression analysis, time series analysis and forecasting, survival analysis, power analysis and variety of other methods. Statistical charts, data transformations and data sampling are also supported.
Multi-platform
StatFi is available for both PC and Mac platforms (PC version includes standalone version StatPlus and Excel add-in StatFi) at no extra charge. Save learning time and costs for your mixed PC and Mac environment.
Free Trial
We have free trial that gives you an opportunity to evaluate the software before you purchase it. Should you have any questions during the trial period, please feel free to contact our Support Team.
Standalone Spreadsheet
Version 6 comes with both Excel add-in (StatFi) and standalone spreadsheet (StatPlus). StatPlus features almost full Microsoft* Excel* 97- -2016 documents support and does not require Microsoft Excel installed.
Requirements
StatFi add-in requires Windows 2000 and Excel 2007 or newer. Windows 7 or newer and Excel 2007 or newer recommended. StatFi compatible with Windows 10 and Excel 2007, 2010, 2013, 2016 and 2019.
Screenshots

StatPlus and StatFi Features List
- Pro Funktionen
- Schnelle eigenständige Tabellenkalkulation.
- Add-In für Excel 2007, 2010, 2013, 2016, 2019 und 2021.
- Priority-Support .
- Kostenlose Haupt-Upgrades während Ihres Wartungszeitraums.
- Basisstatistiken
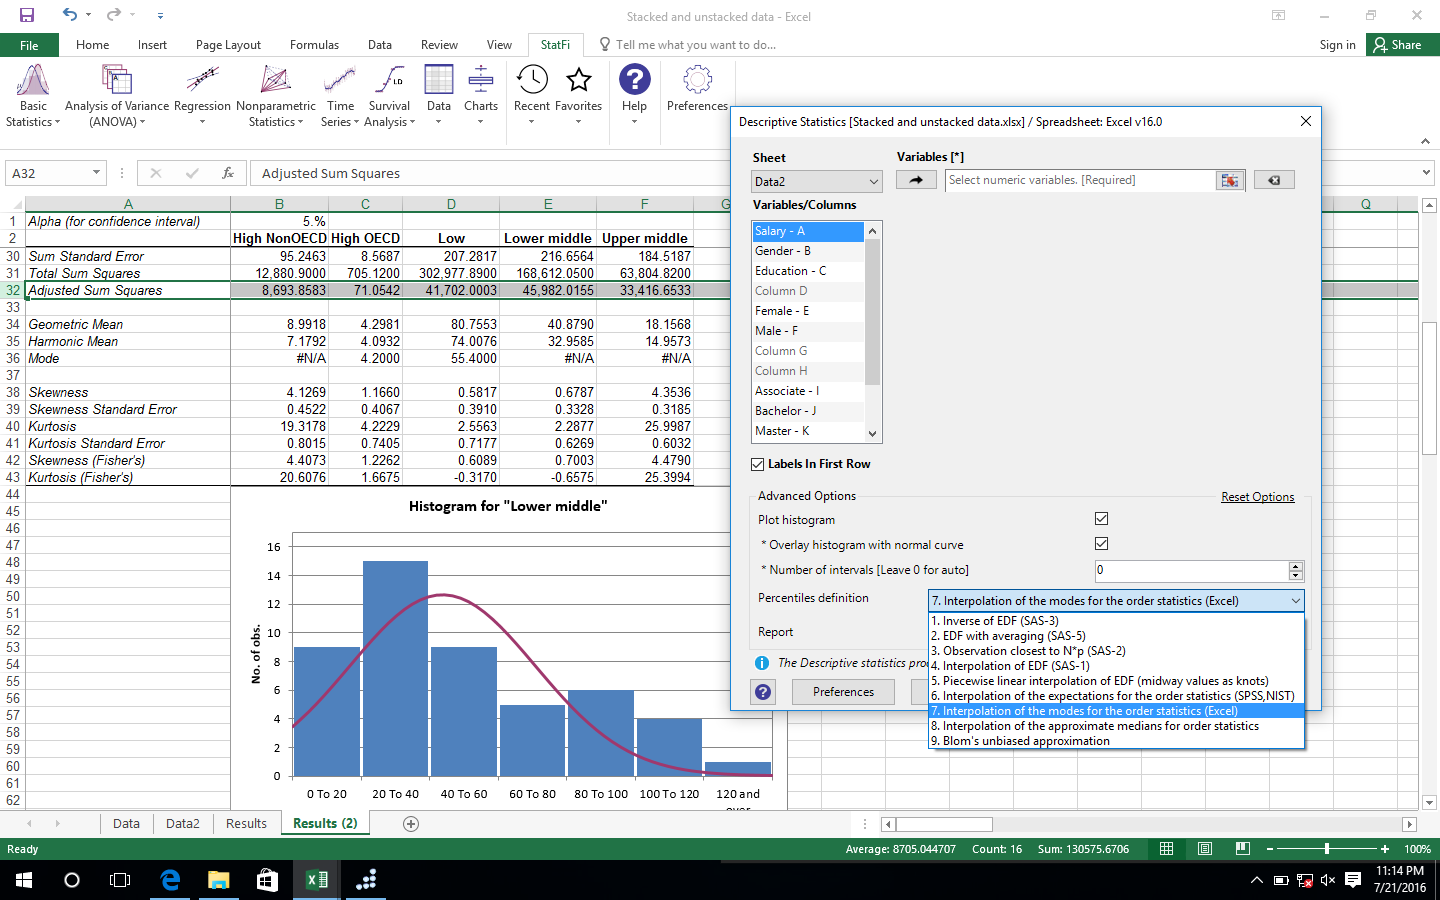
- Detaillierte deskriptive Statistik.
- Ein-Stichproben t-Test.
- Zwei-Stichproben t-test (Mittelwertvergleich).
- Zwei-Stichproben t-test für zusammengefassten Daten.
- Zwei-Stichproben-F-Test.
- Ein-Stichproben-Gauß-Test (z-Test) und Zweistichproben-Gauß-Test (z-Test).
- Lineare Korrelation (Pearson) und Kovarianzanalyse.
- Testen auf Normalverteilung (Jarque-Bera-Test, Shapiro-Wilk-Test, Shapiro-Francia-Test, Cramer-von-Mises-Test, Anderson-Darling-Test, Kolmogorow-Smirnow-Test, D'Agostino-Test).
- Kontingenztafel und Chi-Quadrat-Test.
- Häufigkeitstabellen für diskrete und kontinuierliche Variablen.
- Es gibt mehrere Methoden für die Berechnung der Quantile.
- Varianzanalyse (ANOVA)
- Einfaktorielle und Zweifaktorielle Varianzanalyse.
- Dreifaktorielle Varianzanalyse.
- Post-hoc-Vergleiche - Bonferroni, Tukey-Kramer, Tukey B, Tukey HSD, Neuman-Keuls, Dunnett.
- Varianzanalyse mit Messwertwiederholung und Mixed-ANOVA.
- Multivariate Analyse
- Hauptkomponentenanalyse (PCA).
- Faktorenanalyse (FA).
- Diskriminanzanalyse (DF).
- K-Means und Hierarchische Clusteranalyse.
- Nichtparametrische Verfahren
- 2x2-Kontingenztafel-Analyse (Chi-Quadrat, Yates Chi-Quadrat, Exakter Fisher-Test, usw.).
- Rang und Perzentile.
- Chi-Quadrat-Test.
- Rangkorrelation (Kendall'sche Tau, Spearman'sche Rho, Gamma, ...).
- Unabhängiger Stichproben vergleichen
Mann-Whitney-U-Test, Kolmogorow-Smirnow-Test, Wald-Wolfowitz Runs-Tes, Rosenbaum Criterion. Kruskal-Wallis-Test und Median-Test. - Abhängiger Stichproben vergleichen
Wilcoxon-Test (MPSR-Test), Vorzeichen-Rangtest, Friedman-Test, Kendall’scher Konkordanzkoeffizient W. - Cochran-Q-Test.
- Regression
- Lineare Regression (Residuenanalyse, Kollinearitätsdiagnostik, Vorhersageband, Vertrauensband).
- Gewichtete Regression (WLS).
- Binäre logistische Regression.
- Schrittweisen Regression (Rückwärtselimination und Vorwärtsauswahl).
- Polynomische Regression.
- Kurvenanpassung.
- Tests auf Heteroskedastizität (Breusch–Pagan-Test, Harvey-Test, Glejser-Test, Engle's ARCH-Test und White-Test).
- Zeitreihenanalyse
- Datenverarbeitung.
- Schnelle Fourier-Transformation.
- Exponentielle Glättung.
- Gleitender Durchschnitt.
- Analyse.
- Autokorrelation und Partielle Autokorrelation (ACF, PACF).
- Unterbrochen Zeitreihenanalyse.
- Einheitswurzel and Stationarität-Tests (unit-root): Dickey–Fuller-Test, Augmented Dickey–Fuller-Test (ADF), Phillips–Perron-Test, Kwiatkowski–Phillips–Schmidt–Shin-Test (KPSS).
- Überlebensanalyse
- Sterbetafeln.
- Kaplan-Meier (Log-rank-Test, Gefahrenquoten).
- Cox-Regression.
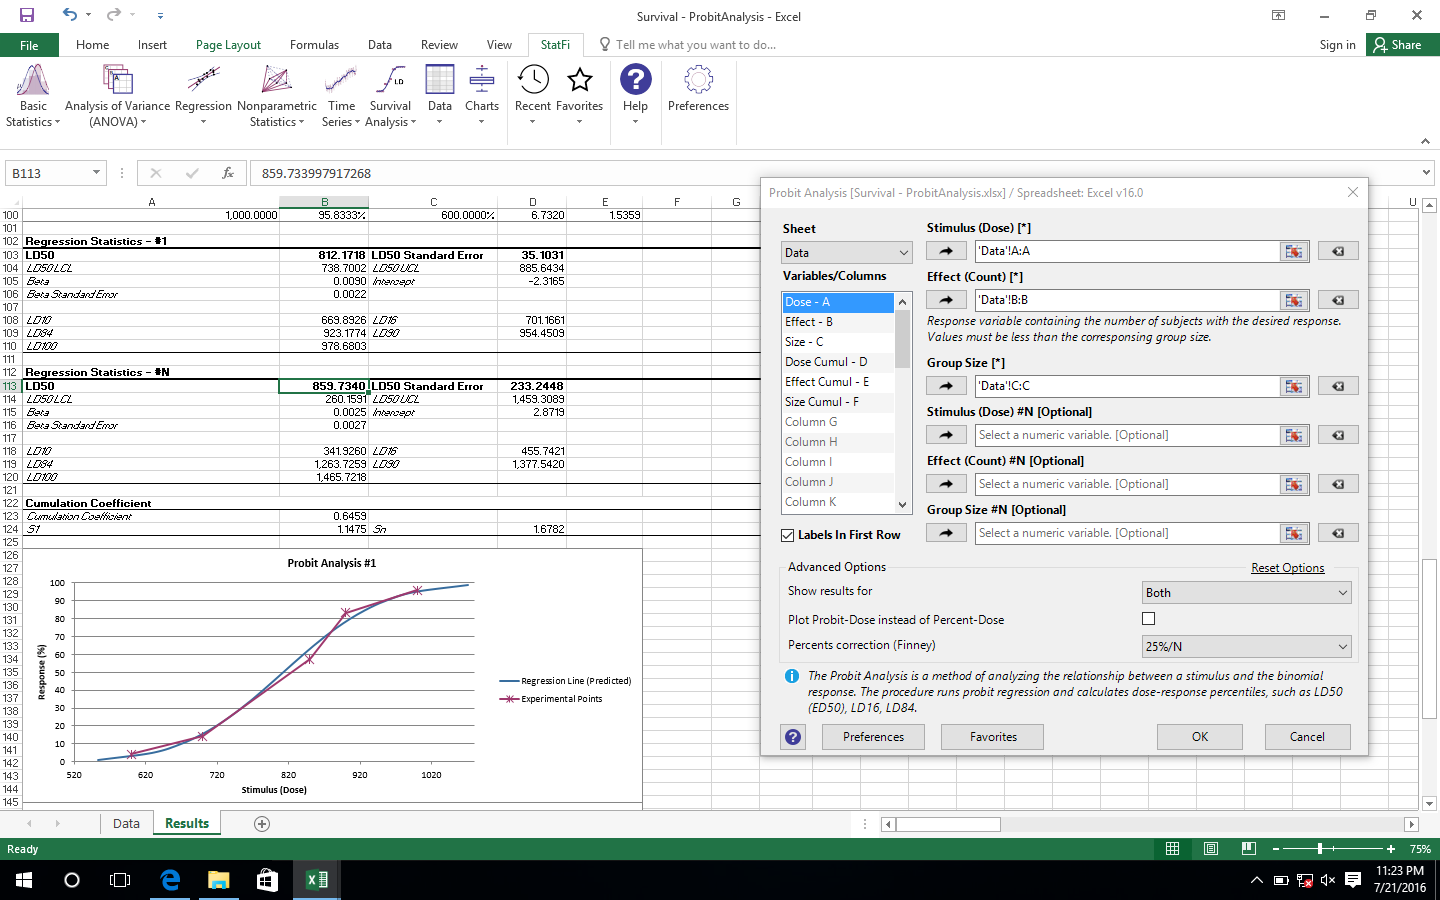
- Probit-Analyse (Finney und LWM)
LD50 (ED50), berechnung der Kumulativerkoeffizient. - ROC-Kurven-Analyse (Grenzwertoptimierungskurve).
Vergleiche der ROC-AUC wurden nach der Methoden von DeLong, Hanley und McNeil. Ein Bericht enthält: AUC (Fläche unter der ROC-Kurve) mit Konfidenzintervall, Koordinaten der ROC-Kurve, Indikatoren - Sensitivität und Spezifität (mit Konfidenzintervall), Richtigkeit, Positiver Vorhersagewert und Negativer Vorhersagewert, Youden-Index J, Genauigkeitsrückrufkurve. - ROC-Kurven vergleichen.
- Daten
- Auswahlverfahren (zufällige, periodische, mit einer Bedingung).
- Zufallszahlengeneratoren.
- Variable standardisieren.
- Gestapelte und ungestapelte Daten.
- Matrizenoperationen.
- Diagramme
- Histogramm
- Streuungsdiagramm.
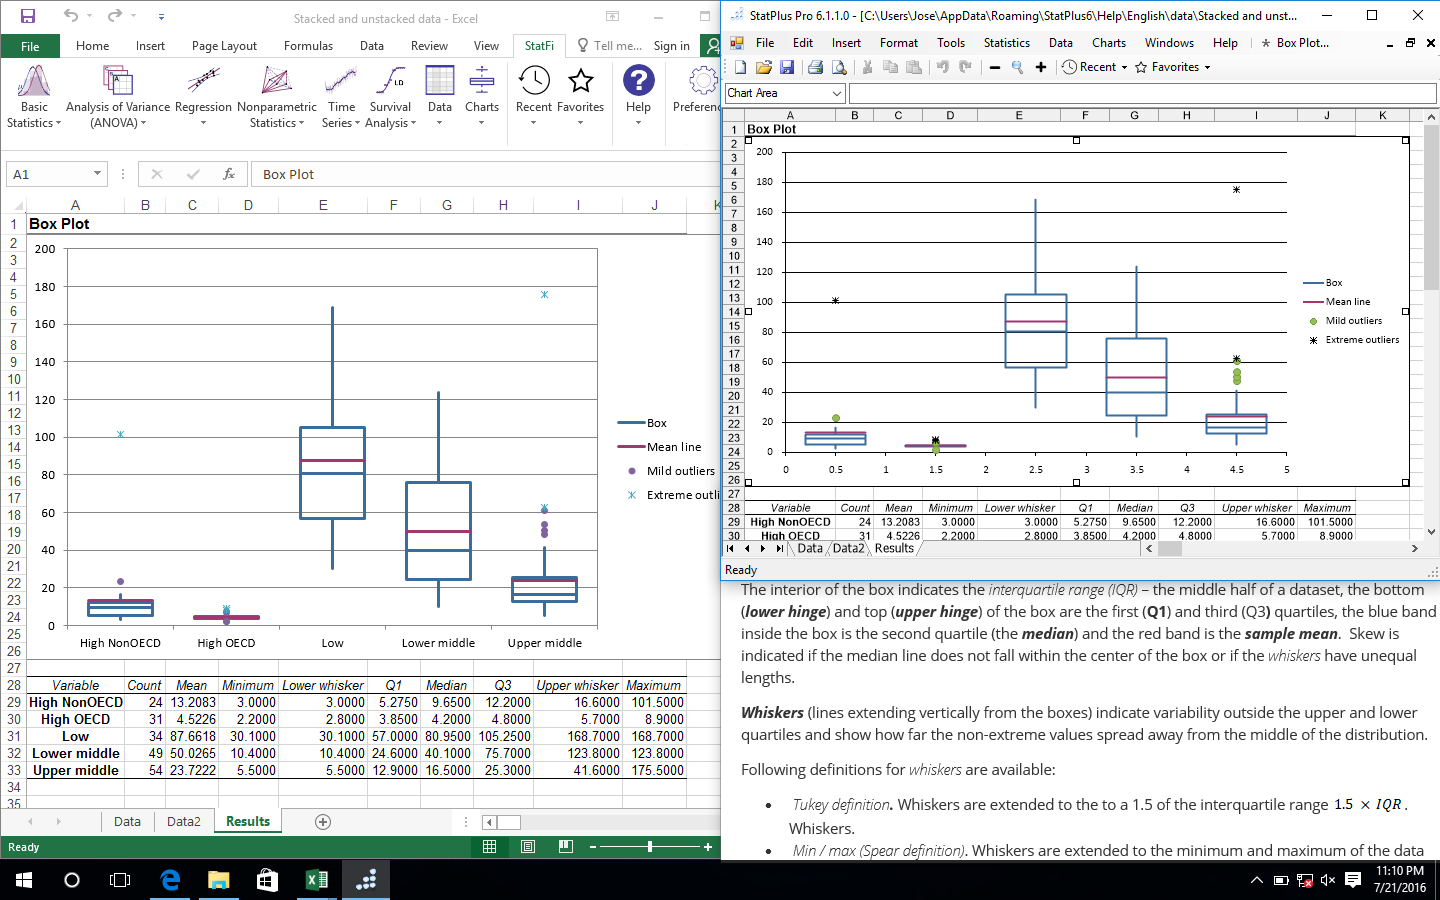
- Boxplot (Kastengrafik).
- Stamm-Blatt-Diagramm.
- Bland-Altman-Plot
- Quantil-Quantil-Diagrammen (Q-Q-Diagrammen) für verschiedene Verteilungen.
- Kontrollkarten — X-quer-Karte, R-Karte, S-Karte, IMR-Karte, P-Karte, C-Karte, U-Karte, CUSUM-Karte.
Copyright ©2026 AnalystSoft Inc.
All rights reserved.

