StatFi
Unleash the full power of precise statistical analysis in Microsoft Excel. With StatFi you can perform complex data analysis in the familiar environment. No need to learn the new tricks with StatFi!
Bare Microsoft Excel is of very limited use for performing complex statistical analysis. Unless your analysis setup as basic as simple summaries or simple tests, and unless the precision requirements are rough, using Excel to perform the analytical tasks is a bad idea. Fortunately, your choice is not limited to either Excel or industrial software. StatFi expands the statistical and analytical abilities of Microsoft Excel, adding wide variety of methods and precise calculations.
StatFi 6 comes as a part of StatPlus 6 package.
Affordable
Heavy-duty stand-alone statistical packages are available on the market, but are you prepared to learn the new workflow? Switching applications means learning how to use the new tool, possibly spending hours to learn about the features you might never need. Considering the cost of most stand-alone analytical packages, they are ruled out of the equation by many users. With StatFi you will benefit from both the reduced learning curve and attractive pricing. License is permanent, there is no renewal charges.
Statistics
StatFi enables you to perform analytical and statistical calculations such as basic statistics, ANOVA, non-parametric and regression analysis, time series analysis and forecasting, survival analysis, power analysis and variety of other methods. Statistical charts, data transformations and data sampling are also supported.
Multi-platform
StatFi is available for both PC and Mac platforms (PC version includes standalone version StatPlus and Excel add-in StatFi) at no extra charge. Save learning time and costs for your mixed PC and Mac environment.
Free Trial
We have free trial that gives you an opportunity to evaluate the software before you purchase it. Should you have any questions during the trial period, please feel free to contact our Support Team.
Standalone Spreadsheet
Version 6 comes with both Excel add-in (StatFi) and standalone spreadsheet (StatPlus). StatPlus features almost full Microsoft* Excel* 97- -2016 documents support and does not require Microsoft Excel installed.
Requirements
StatFi add-in requires Windows 2000 and Excel 2007 or newer. Windows 7 or newer and Excel 2007 or newer recommended. StatFi compatible with Windows 10 and Excel 2007, 2010, 2013, 2016 and 2019.
Screenshots

StatPlus and StatFi Features List
- Pro Features
- Fast and powerful standalone spreadsheet.
- Add-in for Excel 2007, 2010, 2013, 2016, 2019 and 2021.
- Priority support.
- Permanent license with free major upgrades during the maintenance period.
- Options to emulate Excel Analysis ToolPak results and migration guide for users switching from Analysis ToolPak.
- Basic Statistics
- Detailed descriptive statistics.
- One-sample t-test.
- Two-sample t-test.
- Two-sample t-test for summarized data.
- Fisher F-test.
- One-sample and two-sample z-tests.
- Correlation analysis and covariance.
- Normality tests (Jarque-Bera, Shapiro-Wilk, Shapiro-Francia, Cramer-von Mises, Anderson-Darling, Kolmogorov-Smirnov, D'Agostino's tests).
- Cross-tabulation and Chi-square.
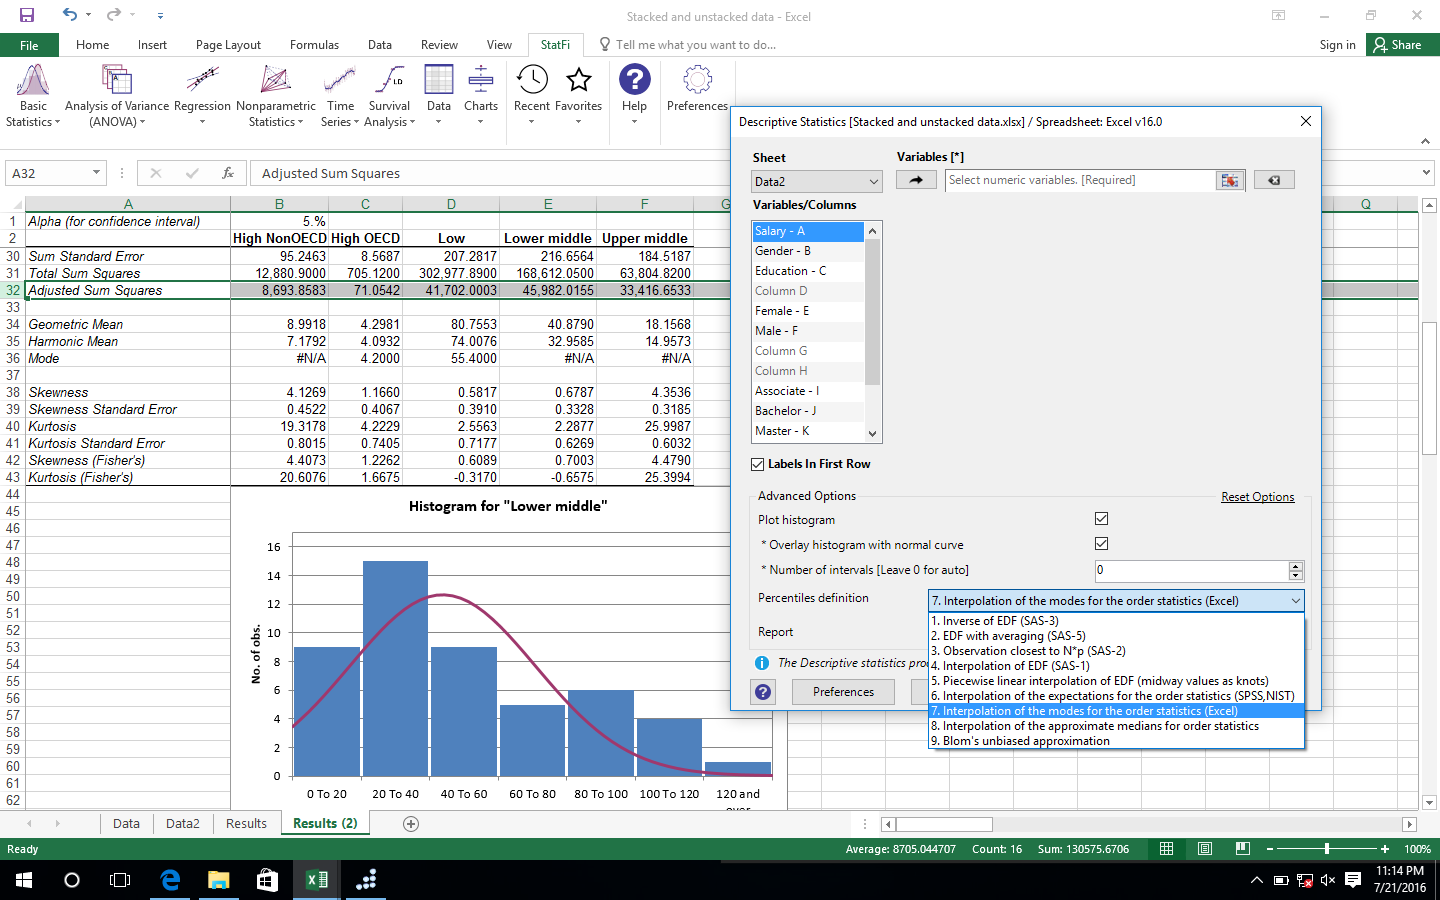
- Frequency tables analysis (for discrete and continuous variables).
- Multiple definitions for computing quantile statistics.
- Analysis of Variance (ANOVA)
- One-way and two-way ANOVA (with and without replications).
- Three-way analysis of variance.
- Post-hoc comparisons - Bonferroni, Tukey-Kramer, Tukey B, Tukey HSD, Neuman-Keuls, Dunnett.
- Within subjects ANOVA and mixed models.
- Multivariate Analysis
- Principal component analysis (PCA).
- Factor analysis (FA).
- Discriminant function analysis.
- Hierarchical Clustering and K-Means.
- Nonparametric Statistics
- 2x2 tables analysis (Chi-square, Yates Chi-square, Exact Fisher Test, etc.).
- Rank and percentile.
- Chi-square test.
- Rank correlations (Kendall Tau, Spearman R, Gamma, Fechner).
- Comparing independent samples
Mann-Whitney U Test, Kolmogorov-Smirnov test, Wald-Wolfowitz Runs Test, Rosenbaum Criterion. Kruskal-Wallis ANOVA and Median test. - Comparing dependent samples
Wilcoxon Matched Pairs Test, Sign Test, Friedman ANOVA, Kendall's W (coefficient of concordance). - Cochran's Q Test.
- Regression Analysis
- Multivariate linear regression (residuals analysis, collinearity diagnostics, confidence and prediction bands).
- Weighted least squares (WLS) regression.
- Logistic regression.
- Stepwise (forward and backward) regression.
- Polynomial regression.
- Curve fitting.
- Tests for heteroscedasticity: Breusch–Pagan test (BPG), Harvey test, Glejser test, Engle's ARCH test (Lagrange multiplier) and White test.
- Time Series Analysis
- Data processing.
- Fourier analysis.
- Smoothing.
- Moving average.
- Analysis.
- Autocorrelation (ACF and PACF).
- Interrupted time series analysis.
- Unit root tests - Dickey–Fuller, Augmented Dickey–Fuller (ADF test), Phillips–Perron (PP test), Kwiatkowski–Phillips–Schmidt–Shin (KPSS test).
- Survival Analysis
- Life tables.
- Kaplan-Meier (log rank test, hazard ratios).
- Cox proportional-hazards regression.
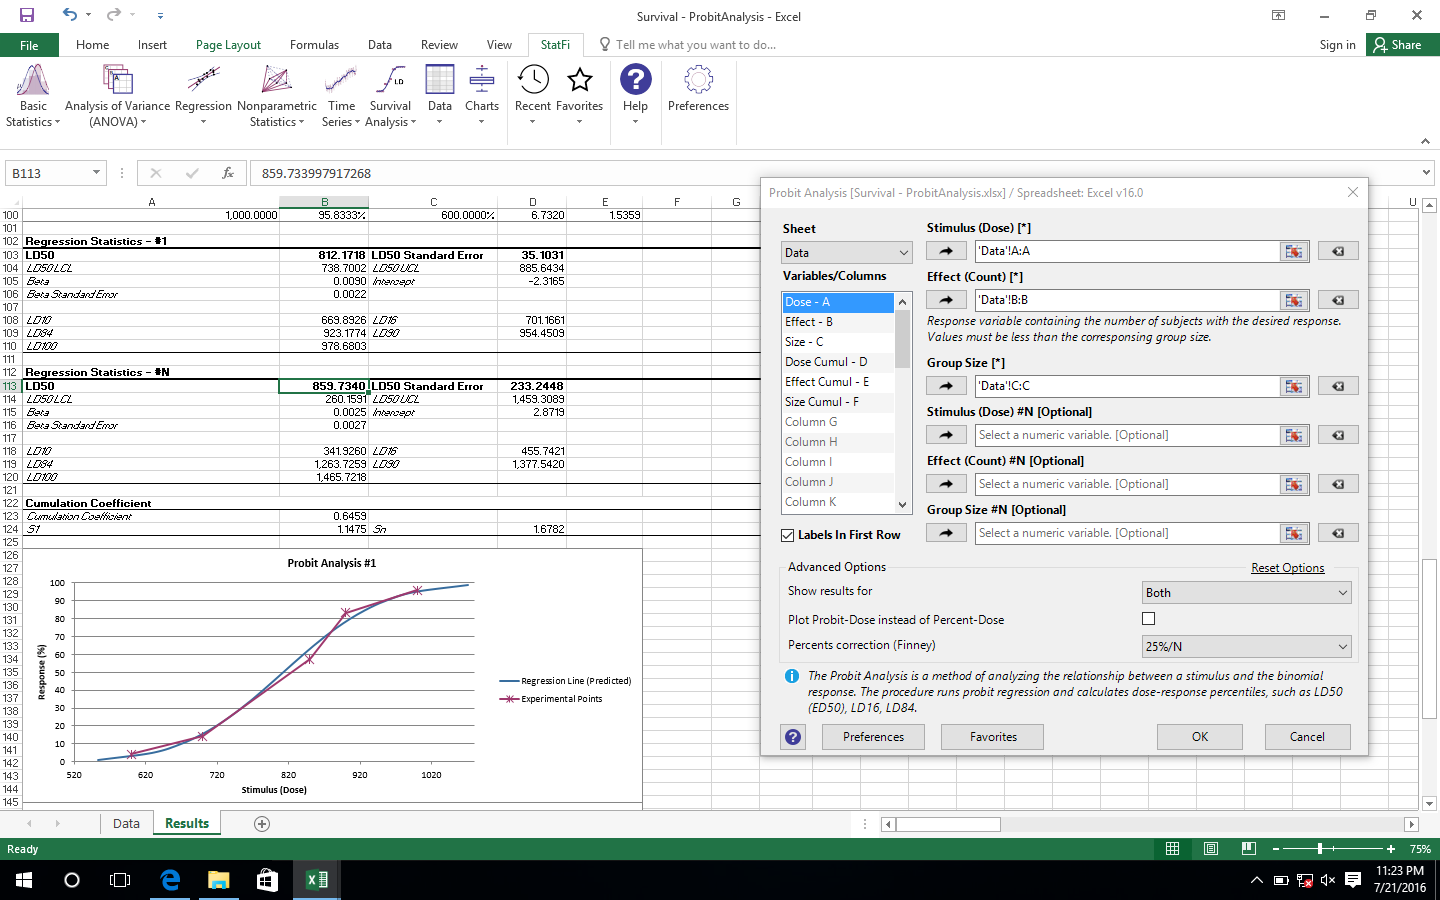
- Probit-analysis (Finney and LPM).
LD values (LD50/ED50 and others), cumulative coefficient calculation. - Receiver operating characteristic curves analysis (ROC analysis).
AUC methods - DeLong's, Hanley and McNeil's. Report includes: AUC (with confidence intervals), curve coordinates, performance indicators - sensitivity and specificity (with confidence intervals), accuracy, positive and negative predictive values, Youden's J (Youden's index), Precision-Recall plot. - Comparing ROC curves.
- Data Processing
- Sampling (random, periodic, conditional).
- Random numbers generation.
- Standardization.
- Stack/unstack operations.
- Matrix operations.
- Statistical Charts
- Histogram
- Scatterplot.
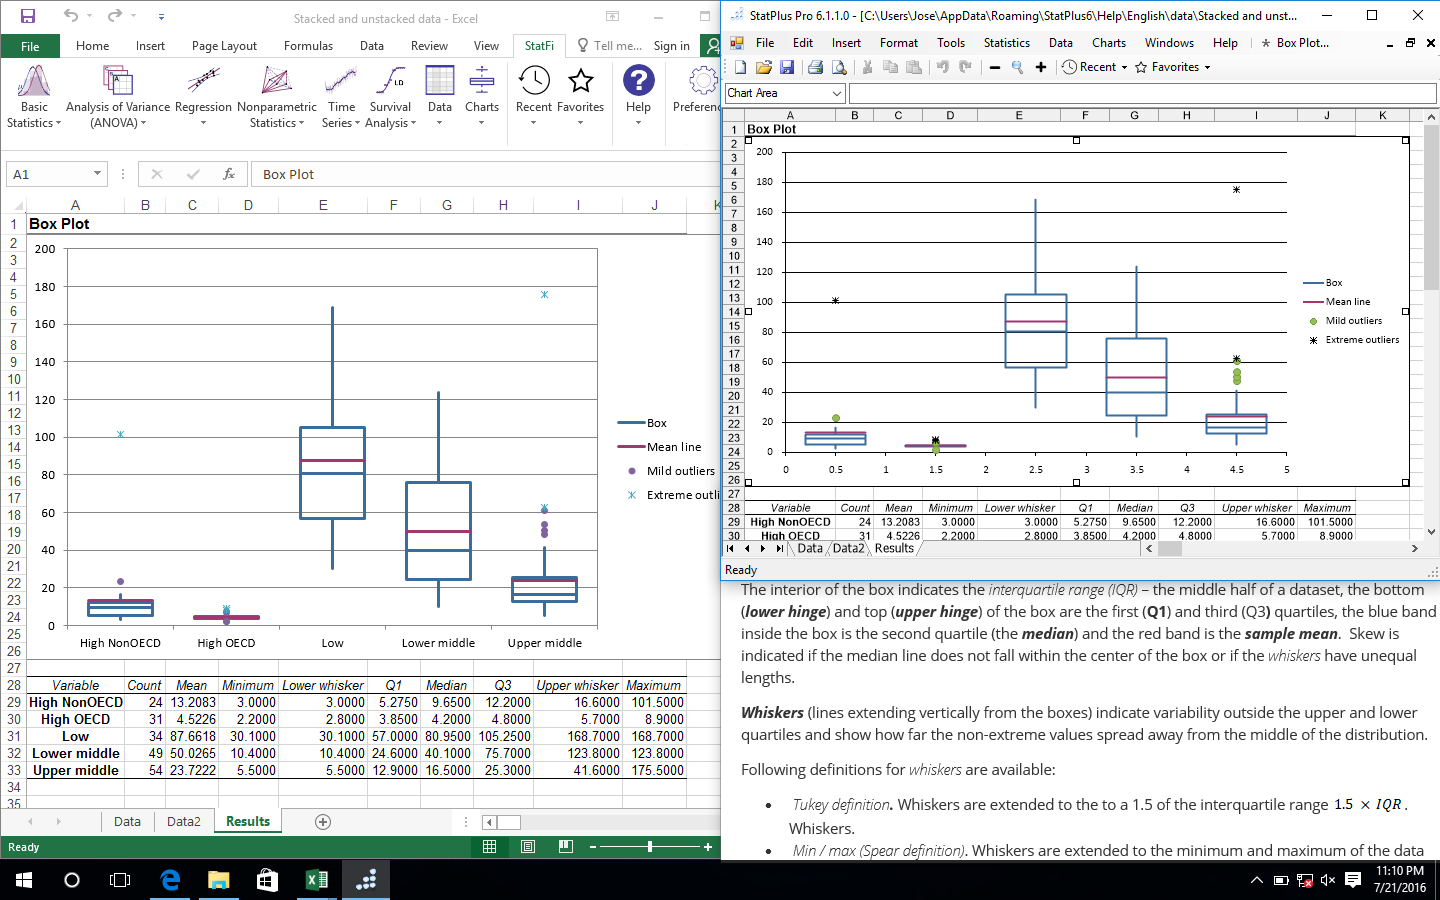
- Box plot.
- Stem-and-leaf plot.
- Bland-Altman plot.
- Bland-Altman plot with multiple measurements per subject.
- Quantile-quantile Q-Q plots for different distributions.
- Control charts - X-bar, R-chart, S-chart, IMR-chart, P-chart, C-chart, U-chart, CUSUM-chart.
Copyright ©2026 AnalystSoft Inc.
All rights reserved.

