One-Sample z-Test
The One-Sample z-test is used when we want to know whether the difference between the mean of a sample mean and the mean of a population is large enough to be statistically significant, that is, if it is unlikely to have occurred by chance. The test is considered robust for violations of normal distribution and it is usually applied to relatively large samples (N > 30) or when the population variance is known, otherwise you might consider using t-test.
Assumptions
1. Mean and variance of the population are known.
2. The test statistic follows normal distribution.
How To
Run: Statistics→Basic Statistics→One Sample z-Test for Mean...
Select the variable. For summarized data please use the Statistics→Basic Statistics→One Sample z-Test for Mean (use summarized data)... command.
Enter the population mean hypothesized
value ![]() and
the population variance
and
the population variance ![]() (known).
(known).
If the population standard deviation ![]() is
known instead of the variance – square the standard deviation value to calculate
the population variance value.
is
known instead of the variance – square the standard deviation value to calculate
the population variance value.
Results
Mean, Variance, Sample Size – the mean, variance and size of the input variable. See the Descriptive Statistics procedure for more information.
Alpha – value of the critical alpha level. It is used to determine whether the null hypothesis should be rejected or retained. Default value can be changed in the Preferences.
Hypothesized mean (Test Constant, H0
Value) - hypothesized population mean (fixed estimate) ![]() .
.
Null hypothesis: ![]() .
.
Population Variance - population
variance ![]() .
.
Mean Difference – difference between the sample mean and the hypothesized value.
Standard Error - estimated standard
error for the mean difference (between the sample mean ![]() and
the hypothesized mean value
and
the hypothesized mean value ![]() ).
).
![]()
z (Test statistic) – z-score, the distance from the sample mean to the population mean in units of the standard error.
![]()
Z – ![]() critical
value for z.
critical
value for z.
If the z (test statistic) is
greater than the two-tailed critical value Z, the
null hypothesis is rejected. Or if the two-tailed p-value is less than ![]() (0.05)
the null hypothesis is rejected, and the conclusion is that, statistically, the
sample mean is significantly different from the hypothesized value.
(0.05)
the null hypothesis is rejected, and the conclusion is that, statistically, the
sample mean is significantly different from the hypothesized value.
p-level is provided for the alternative hypotheses.
|
z-Test |
Null hypothesis H0 |
Alternative hypothesis H1 |
p-value |
|
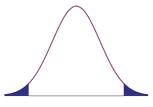
Two-tailed |
|
|
|
|
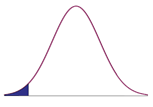
Lower-tailed |
|
|
|
|
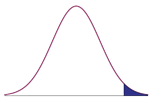
Upper-tailed |
|
|
|
References
Sprinthall, R. C. (2011). Basic Statistical Analysis (9th ed.). Pearson Education.