Compare Means (T-Test)
The Compare Means procedure compares the means of two variables.
The t-test (Student's t-test) assesses whether the means of two groups are statistically different from each other. There are three types of t-test available:
· Two-sample assuming equal variances (homoscedastic);
· Two-sample assuming unequal variances (heteroscedastic), used when variances of the variables are extremely different;
· Paired two-sample t-test, used to compare means on the same or related subject over time or in differing circumstances. Does not assume that the variances of both populations are equal.
The independent t-test provides an exact test for the equality of the means of two normal populations with unknown, but equal, variances and it is the most uniformly powerful (UMP) test (Sawilowsky, Blair, 1992). For moderately large samples, the t-test becomes very similar to the Z-test, and is therefore robust to moderate violations of the normality assumption for moderate or large sample sizes.
The Behrens-Fisher problem may arise in the comparison of two treatments when the variances are unknown and possibly not equal. A widely used approximate solution is Welch’s t-test (Welch, 1947), nearly exact test for the case where the data are normal but the variances may differ.
How To
Run: Statistics→Basic Statistics→Compare Means (T-Test)...
Select two variables to compare.
Enter the hypothesized means difference. A value of 0 (zero) indicates that the sample means are hypothesized to be equal.
Select the t-test type appropriate for your data.
Pairwise missing values deletion is used for the paired t-test, otherwise the analysis by analysis deletion is used.
OR
To run the t-test for summarized data (i.e. sample is described by mean, standard deviation and sample size) – run the Statistics→Basic Statistics→Compare Means (use summarized data) command and enter the mean, standard deviation and sample size of both variables by keyboard. Paired t-test is unavailable for the summarized data.
Results
Descriptive Statistics section provides summary statistics for each variable.
Two-Sample T-Test Assuming Equal Variances
Assumptions:
1. The samples are from two normal populations.
2. One or both sample sizes are less than 30.
3. The unknown variances of the two populations are equal.
Pooled Variance – unbiased
estimator of the common variance of several different populations when they are
assumed to have the same variance of each population. ![]() defined
as
defined
as
![]()
The pooled standard deviation ![]() gives a weighted average of the standard deviations of
the two samples. The pooled standard deviation is going to be between the two
standard deviations, with greater weight given to the standard deviation from a
larger sample.
gives a weighted average of the standard deviations of
the two samples. The pooled standard deviation is going to be between the two
standard deviations, with greater weight given to the standard deviation from a
larger sample.
Test Statistic – statistic of the t-test. Test statistic either exactly follows or closely approximates a t-distribution under the null hypothesis is given.

Where ![]() is
the hypothesized means difference,
is
the hypothesized means difference, ![]() and
and
![]() –
sample mean for the first and second samples correspondingly.
–
sample mean for the first and second samples correspondingly.
Degrees Of Freedom – are
defined as ![]()
P(T<=t) for Two-Tailed Distribution (Two-tailed test), One-Tailed (Lower
tailed test) Distribution - the p-value for a t-test. If the p-value is
less than 0.05, the conclusion is that, statistically, the means are
significantly different. Alternative hypothesis H1 for the
two-tailed test is ![]() ,
H1 for the one-tailed (lower-tailed) is
,
H1 for the one-tailed (lower-tailed) is ![]() .
.
Two-Sample T-Test Assuming Unequal Variances
Assumptions:
1. The samples from two normal populations are independent.
2. One or both sample sizes are less than 30.
3. The unknown variances of the two populations are not equal.
Pooled Variance

Test Statistic
Degrees Of Freedom

Paired Two-Sample T-Test
This test is used when the samples are dependent; that is, when there is only one sample that has been tested twice (repeated measures) or when there are two samples that have been matched or "paired".
Assumes that the observed data are from the same subject or from a matched subject and are drawn from a population with a normal distribution
Does not assume that the variances of both populations are equal.
Test Statistic
![]()
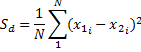
Where ![]() is the standard deviation for difference
is the standard deviation for difference ![]() .
.
Degrees Of Freedom ![]()
References
Best, D. J., Rayner, J. C. W. (1987). Welch's Approximate Solution for the Behrens-Fisher Problem. Technometrics, Vol. 29, No. 2, pp. 205-210.
Kim and Allan Cohen (1995). "On the Behrens–Fisher Problem: A Review". University of Wisconsin–Madison, 1995. Paper presented at the annual meeting of the Psychometric Society, Minneapolis.
Sawilowsky, S., Blair, R. C. (1992). A more realistic look at the robustness and Type II error properties of the t-test to departures from population normality. Psychological Bulletin, 111(2), 352-360.
Welch, B. L. (1947). "The generalization of "Student's" problem when several different population variances are involved". Biometrika 34 (1–2): 28–35.