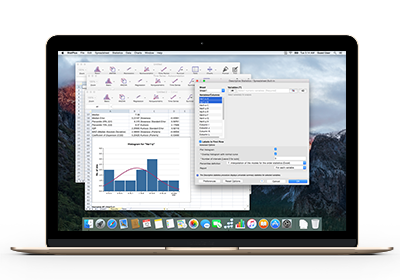
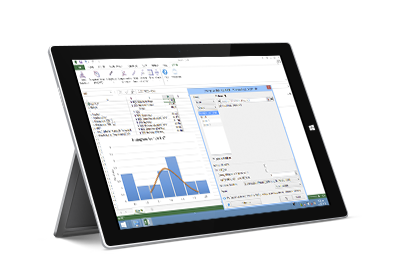
Help
  • B Basic Statistics
    • Descriptive Statistics
    • Descriptive Statistics
      (group variable)
    • One-Sample T-Test
    • One-Sample z-Test
    • Compare Means (T-Test)
    • Compare Means
      (summarized data)
    • Two-Sample z-Test
    • F-Test
    • Linear Correlation
    • Covariance
    • Normality Tests
    • Frequency Tables
    • Crosstabs and Chi-Square
    • Histogram
  • A Analysis of Variance
    • One-way ANOVA
    • Two-way ANOVA
    • Three-way ANOVA
    • Repeated Measures (Within Subjects)
    • Mixed Treatment by Subjects
    • Mixed ANOVA with Two Treatments
  • R Regression
    • Multiple Linear Regression
    • Weighted Least Squares
    • Polynomial Regression
    • Forward Selection
    • Backward Stepwise
    • Best Subsets Regression
    • Binary Logistic
    • Cox Regression
  • N Nonparametric Statistics
    • 2x2 Tables Analysis
    • Crosstabs and Chi-Square
    • Rank and Percentile
    • Rank Correlations
    • Fechner Correlation
    • Compare Two Independent
    • Compare Multiple Independent
    • Compare Two Related
    • Compare Multiple Related
    • Cochran's Q Test
  • T Time Series
    • Autocorrelation and Partial ACF
    • Moving Average
    • Interrupted Series Analysis
    • Remove Mean
    • Differences
    • Exponential Smoothing
    • Fast Fourier Transform
  • S Survival Analysis
    • Probit Analysis
    • Cox Regression
  • Data
    • Matrix Operations
    • Random Sample
    • Periodic Sample
    • Conditional Sample
    • Stack Columns
    • Unstack Column
    • Standardize Variables
    • Random Numbers Generation
  • Charts
    • Box Plot
    • Scatter Diagram
    • Histogram
    • X-bar and R Chart
    • X-bar and S Chart
    • CUSUM Chart
    • P Chart
    • C Chart
    • U Chart
    • I-MR Chart
  • Send Feedback
  • View as PDF
  • Get Started
  • Datasets
  • What's New

Get Started

Quick start guides for each platform.
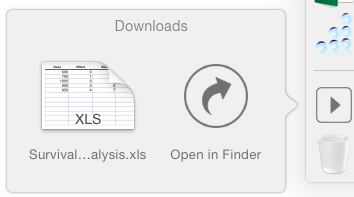
StatPlus on a iPad

iPad

Online

Android

StatPlus on a MacBook

StatPlus:mac

Note to macOS 10.14+ users
Troubleshoot connectivity with Excel and Numbers
StatPlus with Excel on Windows

Windows App/Add‑in

App Preferences

Excel Analysis Toolpak (ATP) Migration

Get Support


© 2019 AnalystSoft Inc. Credits

Datasets

  • ANOVA - Factors
  • Anscombe's Quartet
  • Control Charts
  • Data sample - Conditional
  • Frequency Tables
  • HI LEP Population Profile
  • Fisher's Iris
  • Nonparametric - 2x2 Tables
  • Nonparametric - Chi-Square
  • Nonparametric - Cochran Q
  • Pearson Correlation
  • Regression - Polynomial
  • Road Safety
  • Stacked and unstacked data
  • Survival - Cox Regression
  • Survival - ProbitAnalysis
  • US GDP data (Time Series - Autocorrelation)
Click on a file to save it to your Downloads folder or open in the StatPlus app.

What's New

Help:
  • Some articles include a workbook with example, step-by-step tutorial and PDF version.

    Screenshot of a new article navigation bar

Apps:
  • New commands and features for StatPlus:mac v7.0.1 update.
 

Quick Access

Compare Multiple Independent Samples [Kruskal-Wallis, Median Test]...

The Kruskal-Wallis ANOVA is a non-parametric method to test if samples are from the same distribution. The test is similar to the parametric one-way ANOVA, except that it is based on ranks rather than means. Median test checks the null hypothesis that the medians of the populations from which two or more samples are drawn are identical.