Histogram
The command produces histograms for selected variables. A histogram is a graphical display of tabulated frequencies, shown as bars, that indicates what proportion of cases fall into each of several categories (bins). By default, a histogram has left closed, right open intervals. To plot a histogram for one or multiple categorical variables use the Frequency tables (discrete data) command.
How To
Run: Statistics→Basic Statistics→Histogram...
Select one or more variables. A histogram is created for each variable.
Optionally, select a bin variable. A bin variable contains boundary values that define bin ranges.
If a bin variable is not
selected, a set of evenly distributed bins between the variable's minimum and
maximum values is created, the number of bins k is defined as ![]() , and N is
the total number of observations (Sturges, 1926).
, and N is
the total number of observations (Sturges, 1926).
Optionally, select a frequency variable. Frequency variable contains the number of observations that each row represents. When omitted, each row represents a single observation.
Optionally, select a Break variable. Break (layer) variable distinct values will cause separate histograms to be generated for each variable.
Frequency and layer variables size must match the input variables cases count.
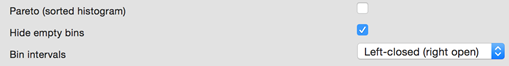
The hide empty bins option is intended to hide/show empty bins in a frequency table.
Pareto (sorted histogram) – if selected, bins in the output table are presented in descending order of frequency. Otherwise, bins are presented in ascending order of the upper boundary.
Results
A frequency distribution table and a histogram are produced for each input variable and for each level of the break variable (if used). Table contains following values:
![]() to
to ![]() - bin
range.
- bin
range.
Count - the number of observations within a bin range.
Cumulative Count - the number of observations with the value less than or equal to the right boundary of the bin (for left-closed bins – strictly less than the right boundary of the bin).
Percent – percentage of observations compared to the count of all observation.
Cumulative Percent - percentage of the observations with the value less than or equal to the right boundary of the range compared to the count of all observation.
References
Sturges, H. A. (1926). The choice of a class interval. Journal of the American Statistical Association, 21, 65‑66.
Velleman, P. F., & Hoaglin, D. C. (1981). Applications, basics, and computing of exploratory data analysis. Boston, Mass: Duxbury Press.