Box Plot
The Box Plot command produces a box-and-whisker plot for each selected variable. A box plot is a type of a graph used to quickly summarize the distribution of a variable, it allows visualizing the five-number summary at once – sample minimum and maximum values, the upper and lower (first and third) quartiles, and the median. Box plots are non-parametric and robust, thus more resistant to the presence of outliers than the classical statistics based on the normal distribution.
How To
Run: Charts → Box Plot command.
Select variables.
Optionally, select a method for computing percentiles. Percentiles are defined according to Hyndman and Fan [HYN], see the Descriptive Statistics for details.
Optionally, select a definition for whiskers calculation.
Results
A box plot and summary statistics for each selected variable are produced.
The interior of the box indicates the interquartile range (IQR) – the middle half of a dataset, the bottom (lower hinge) and top (upper hinge) of the box are the first (Q1) and third (Q3) quartiles, the blue band inside the box is the second quartile (the median) and the red band is the sample mean. Skew is indicated if the median line does not fall within the center of the box or if the whiskers have unequal lengths.
Whiskers (lines extending vertically from the boxes) indicate variability outside the upper and lower quartiles and show how far the non-extreme values spread away from the middle of the distribution.
Following definitions for whiskers are available:
·
Tukey definition. Whiskers are extended to the to a
1.5 of the interquartile range ![]() (Tukey, 1977).
(Tukey, 1977).
· Min / max (Spear definition). Whiskers are extended to the minimum and maximum of the data values (Spear, 1952).
· Mean ± Standard deviation.
· Boxplot based on percentiles [P, 100 – P]. Whiskers are extended to the Pth and 100 - P percentiles. In this case box-plot can represent seven-number summary. Default value for P is 2 – whiskers are extended to the 2nd and 98th percentiles.
Outliers are observations that fall outside whiskers. Outliers are plotted as individual points.
When the Tukey definition is used we distinguish between
mild outliers and extreme outliers. Mild outliers are observations that
fall outside inner fences (below ![]() or
above
or
above ![]() ), and extreme
outliers are observations that fall outside outer fences (below
), and extreme
outliers are observations that fall outside outer fences (below ![]() or
above
or
above ![]() ). Mild
outliers are also labeled as “outside” and extreme outliers are labeled
as "far out".
). Mild
outliers are also labeled as “outside” and extreme outliers are labeled
as "far out".
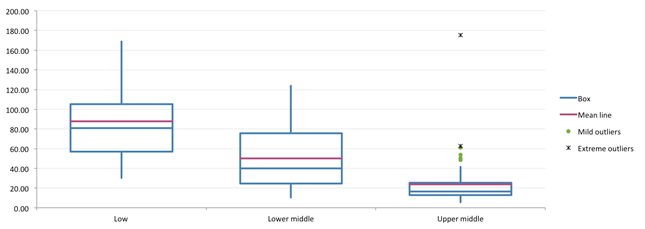
Data
source: variables “Low”, “Lower middle” and “Upper middle” from the
“Stacked and unstacked data” dataset.
In a sample box plot (shown above) all three variables are skewed to the right, but the third variable “Upper-middle” has both mild and extreme outliers, that shows either a measurement error or that the population has a heavy-tailed distribution.
References
[HYN] Hyndman, R.J. and Fan, Y. (November 1996). "Sample Quantiles in Statistical Packages", The American Statistician 50 (4): pp. 361–365.
[KLI] Kline, R. B. (2009). Becoming a behavioral science researcher: A guide to producing research that matters. New York: Guilford Press.
[MAS] D.L. Massart, J. Smeyers-Verbeke, X. Caprona, and Karin Schlesier. Visual presentation of data by means of box plots. LC GC Europe solutions for separation scientist, 18(4):215, April 2005.
[TUK] John W. Tukey (1977). Exploratory Data Analysis. Addison-Wesley
[SPE] Spear, M. Charting Statistics. New York: McGraw-Hill Book Co., Inc., 1952.